EmoGen: Eliminating Subjective Bias in Emotional Music Generation
Abstract
Music is used to convey emotions, and thus generating emotional music is important in automatic music generation. Previous work on emotional music generation directly uses annotated emotion labels as control signals, which suffers from subjective bias: different people may annotate different emotions on the same music, and one person may feel different emotions under different situations. Therefore, directly mapping emotion labels to music sequences in an end-to-end way would confuse the learning process and hinder the model from generating music with precise emotions. In this paper, we propose EmoGen, an emotional music generation system that leverages a set of emotion-related music attributes as the bridge between emotion and music, and divides the generation into two stages: emotion-to-attribute mapping with supervised clustering, and attribute-to-music generation with self-supervised learning. Both stages are beneficial: in the first stage, the attribute values around the clustering center represent the general emotions of these samples, which help eliminate the impacts of the subjective bias of emotion labels; in the second stage, the generation is completely disentangled from emotion labels and thus free from the subjective bias. Both subjective and objective evaluations show that EmoGen outperforms previous methods on emotion control accuracy and music quality respectively, which demonstrate our superiority in generating emotional music.
1. Comparison with Previous Methods
The emotion space is divided by arousal and valence into four quadrants based on Russell's 4Q model (paper link), as shown in the following Figure 1. "Qi" represents the i-th quadrant.
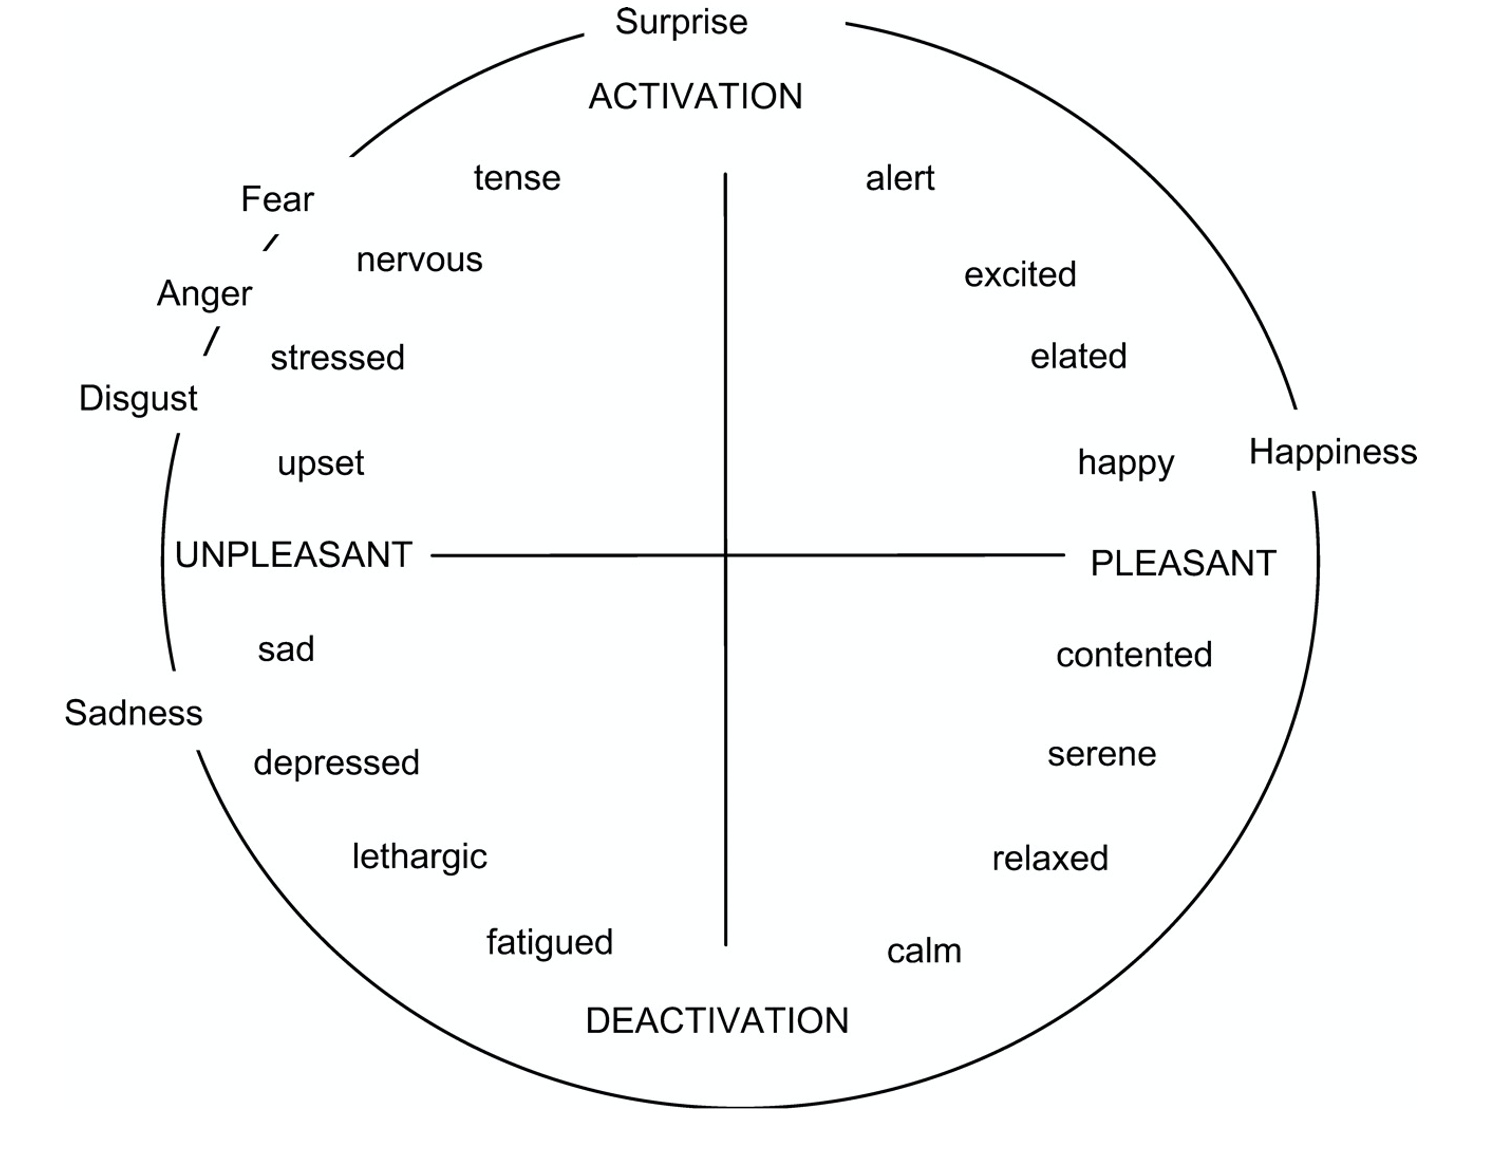
Figure.1 Russell's 4Q model(https://psu.pb.unizin.org/psych425/chapter/circumplex-models/). According to the valence (x-axis) and arousal (y-axis), human emotions can be divided into four quadrants.
We compare EmoGen with Conditional Sampling (CS, paper link) and Predictor Upper Confidence for Trees (PUCT, paper link). In order to conduct thorough evaluations, we design two training settings: 1) Setting 1: To ensure the music quality of generated music, following previous work, we pre-train the models on Pop1k7+LMD-Piano before fine-tuning on EMOPIA. 2) Setting 2: To demonstrate that EmoGen does not rely on labeled datasets and can leverage arbitrary datasets for emotional music generation, we train the generative model on Pop1k7+LMD-Piano+EMOPIA in the attribute-to-music generation stage. Since CS and PUCT require only labeled data in training, they cannot work in this setting. We present music pieces of these methods as follows.
| Method | Emotion | Audio | Description |
|---|---|---|---|
| EmoGen (Setting 1) | Q1 |
|
These music pieces sound bright and fast, with a sense of power. Therefore, they belong to Q1. |
| Q2 | These music pieces sound solemn, dark and powerful. Therefore, they belong to Q2. |
||
| Q3 | These music pieces are slow and sound relatively subdued and sad. Therefore, they belong to Q3. |
||
| Q4 | The tempo of these pieces is slow. And they sound bright and relaxed, so they belong to Q4. |
||
| CS (Setting 1) | Q1 |
|
The tempo of the first and second pieces is fast. The first piece sounds relatively tense, which belongs to the boundary of Q1 and Q2. The second piece sounds bright thus belongs to Q1. The third piece sounds slow and bright, thus it belongs to the boundary of Q1 and Q4. |
| Q2 | The tempo of the first piece is slow and the first piece sounds relative calm, thus it belong to the boundary of Q3 and Q4. The second and the third pieces are fast and the second piece is relatively bright, which belongs to the boundary of Q1 and Q2. The third piece sounds relatively tense thus it belongs to Q2. |
||
| Q3 | These music pieces sound relatively calm or fatigued (especially the first one), so they belong to the boundary of Q3 and Q4. |
||
| Q4 | The first and second piece sound slow and calm, which belong to Q4. The third piece sounds bright, and the tempo is relatively fast, so it belongs to the boundary of Q1 and Q4. |
||
| PUCT (Setting 1) | Q1 |
|
These music pieces sound calm and relatively slow. Therefore, they belong to the boundray of Q1 and Q4. |
| Q2 | The tempo of these music clips is slow. The second piece sounds bright which belongs to the boundary of Q1 and Q2. The others sound heavy and depressing, which belong to the boundary of Q2 and Q3. |
||
| Q3 | The first and second pieces sound fast and relatively bright, so they do not belong to Q3. The third piece sounds relatively calm, which belongs to the boundary of Q3 and Q4. |
||
| Q4 | The first and second pieces sound slow and calm, which belong to Q4. The third piece is relatively fast and belongs to the boundary of Q1 and Q4. |
||
| EmoGen (Setting 2) | Q1 |
|
These music pieces sound bright and relatively fast. Therefore they belong to Q1. |
| Q2 | | These music clips sound tense and heavy, so they belong to Q2. | |
| Q3 | | The music pieces sounds relatively slow and depressing. Therefore, they belong to Q3. | |
| Q4 | | There music pieces sound calm and serene so they belong to Q4. |
- Given an emotion quadrant as the target, although CS and PUCT can generate samples in the corresponding quadrant, they also generate samples with vague emotion (even in other emotional quadrants). Therefore, the proportion of correct samples for CS and PUCT is low.
- In contrast, EmoGen generates samples with more explicit emotion and the proportion of correct samples is higher. Therefore, the emotional control accuracy of EmoGen is higher.
- Besides, subjective evaluation results show that the music quality of EmoGen's samples is also higher than that of CS and PUCT (please refer to Subsection 4.2 in the paper for details).
2. Subjective Bias in Ground Truth
To prove the existence of subjective bias in emotion labels, we select center and boundary pieces from EMOPIA, as shown below (please refer to Subsection 4.3 in the paper for details).| Label | Center | Boundary |
|---|---|---|
| Q1 | ||
| Q2 | ||
| Q3 | ||
| Q4 |
Compared with the pieces from the center, the emotion of the boundary pieces is more ambiguous although their labels are the same. Therefore, there exists subjective bias in ground truth, which will reduce the control accuracy of the end-to-end methods (e.g. CS and PUCT).
3. Experiment on TopMAGD
To evaluate EmoGen’s ability to generate emotional mu- sic on the arbitrary dataset, we conduct experiments of EmoGen on TopMAGD, which is a multi-instrument dataset with no emotion annotation. Here are music pieces generated by EmoGen in this experiment.
Q1
Q2
Q3
Q4
4. Selected Attributes
We select 100 attributes as conditional signals to control music generation. Here is the control accuracy of these attributes: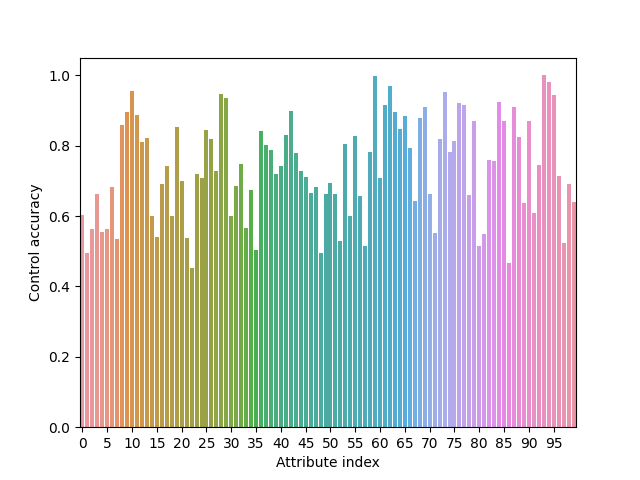
Figure.2 Control accuracy of different attributes.
The selected 100 attributes are shown in the following table. For the specific meaning of these attributes, please refer to jSymbolic Feature Explanations.
| Note Density per Quarter Note | Note Density per Quarter Note Variability | Total Number of Notes | Relative Note Density of Highest Line | Prevalence of Long Rhythmic Values |
| Prevalence of Very Long Rhythmic Values | Average Note to Note Change in Dynamics | Pitch Class Histogram_8 | Rhythmic Value Histogram_10 | Vertical Interval Histogram_43 |
| Variability of Time Between Attacks | Pitch Class Histogram_9 | Rhythmic Value Variability | Pitch Variability | Variability of Rhythmic Value Offsets |
| Vertical Interval Histogram_48 | Rhythmic Value Histogram_2 | Prevalence of Short Rhythmic Values | Rhythmic Value Histogram_1 | Chord Duration |
| Vertical Interval Histogram_36 | Pitch Class Histogram_3 | Minor Major Triad Ratio | Rhythmic Value Histogram_9 | Variation of Dynamics |
| Vertical Interval Histogram_9 | Rhythmic Looseness - Tempo Standardized | Vertical Interval Histogram_16 | Vertical Interval Histogram_39 | Range |
| Pitch Class Histogram_4 | Chord Type Histogram_2 | Vertical Interval Histogram_31 | Chord Type Histogram_1 | Rhythmic Value Histogram_6 |
| Wrapped Vertical Interval Histogram_0 | Pitch Skewness | Importance of High Register | Rhythmic Value Histogram_3 | Vertical Interval Histogram_13 |
| Number of Pitches | Strength of Strongest Rhythmic Pulse - Tempo Standardized | Vertical Interval Histogram_1 | Rhythmic Value Variability in Run Lengths Histogram_2 | Melodic Embellishments |
| Rhythmic Value Kurtosis | Strength of Second Strongest Rhythmic Pulse - Tempo Standardized | Vertical Interval Histogram_7 | Rhythmic Value Variability in Run Lengths Histogram_1 | Melodic Interval Histogram_48 |
| Chord Type Histogram_6 | Rhythmic Value Histogram_11 | Mean Rhythmic Value Run Length | Most Common Pitch | Melodic Interval Histogram_36 |
| Rhythmic Value Histogram_4 | Variability in Rhythmic Value Run Lengths | Importance of Bass Register | Prevalence of Medium Rhythmic Values | Seventh Chords |
| Duration in Seconds | Rhythmic Value Histogram_8 | Melodic Interval Histogram_2 | Prevalence of Very Short Rhythmic Values | Pitch Class Histogram_2 |
| Harmonicity of Two Strongest Rhythmic Pulses - Tempo Standardized | Mean Pitch | Most Common Rhythmic Value | Prevalence of Most Common Rhythmic Value | Contrary Motion |
| Vertical Interval Histogram_38 | Rhythmic Value Histogram_7 | Vertical Interval Histogram_44 | Average Length of Melodic Arcs | Rhythmic Value Variability in Run Lengths Histogram_6 |
| Melodic Interval Histogram_16 | Melodic Pitch Variety | Average Number of Simultaneous Pitches | Number of Relatively Strong Rhythmic Pulses - Tempo Standardized | Importance of Middle Register |
| Melodic Interval Histogram_0 | Vertical Interval Histogram_40 | Prevalence of Most Common Melodic Interval | Beat Histogram Tempo Standardized_32 | Melodic Interval Histogram_12 |
| Pitch Class Histogram_5 | Melodic Interval Histogram_43 | Wrapped Vertical Interval Histogram_9 | Prevalence of Most Common Vertical Interval | Rhythmic Value Histogram_5 |
| Vertical Interval Histogram_34 | Vertical Interval Histogram_22 | Amount of Arpeggiation | Vertical Interval Histogram_51 | Perfect Vertical Intervals |
| Vertical Dissonance Ratio | Mean Pitch Class | Rhythmic Value Median Run Lengths Histogram_10 | Melodic Sixths | Melodic Interval Histogram_4 |